
Visualizing Massive 3D Point Clouds with Dynamic Level-of-Detail
Visualizing large 3D point cloud datasets can be a daunting task. With LumiDB, users store their data in a special purpose database that enables efficient querying based on point budget or density, eliminating the need for preprocessing. Beyond visualization, the stored points remain fully usable for other workflows. This post explores the challenges of visualizing massive point cloud datasets and how LumiDB helps.
Written by
Published on
Do not index
We're LumiDB, a reality capture data management system built to scale across industries, making reality capture data easy, accessible, and fun to use. Request access to the LumiDB alpha, and try our API-driven reality capture management for yourself.
Point cloud data is widely used in fields like construction, architecture, surveying, and autonomous systems. These datasets often consist of hundreds of gigabytes of data, and thousands of individual files, making them difficult to visualize directly without sacrificing detail. The problem arises because rendering such massive datasets can overwhelm visualization tools, causing frame rates to drop to non-interactive levels.
To overcome this problem, current workflows typically involve preprocessing to reduce data size, which can be labor-intensive and may require maintaining multiple level-of-detail versions of the dataset to allow users to zoom in and out. For developers and users of visualization tools, the goal is to optimize rendering performance while retaining critical details—a task that is often more complex than it seems.
One common approach for visualization is meshing, which converts point clouds into surface representations. In addition to improving visual fidelity, this method can improve rendering performance and make data more accessible for certain applications, but it sacrifices the granularity and precision of the original point cloud. Meshing also adds another layer of preprocessing, making it unsuitable for workflows requiring the raw detail of the original dataset.
Another option is Potree, a widely used JavaScript library for point cloud visualization. Potree supports rendering in web browsers, but datasets must be converted into its custom format, which limits its flexibility for metadata and queries other than visualization.
File-based methods, such as STAC (SpatioTemporal Asset Catalog), VPC (Virtual Point Cloud), and COPC (Cloud Optimized Point Cloud), provide useful tools for managing and accessing point cloud data, but each has its limitations. STAC organizes metadata to make geospatial datasets searchable, but it still requires downloading and processing individual files for fine-grained queries. VPC combines tiled datasets into a unified view and supports downsampled previews, yet it relies on preprocessing steps like tiling and remains file-based. COPC optimizes point cloud data for streaming, enabling more efficient access to parts of a dataset, but like the others, it is constrained by file structures.
LumiDB’s Dynamic Level-of-detail Query
LumiDB is a purpose-built database designed to manage, version, and query massive 3D point cloud datasets efficiently. By storing data within LumiDB, users gain capabilities for visualization and level-of-detail (LOD) management as an inherent benefit. This means users avoid redundant copies and complex preprocessing workflows while retaining access to all their high-resolution datasets, ready for visualization or analysis.
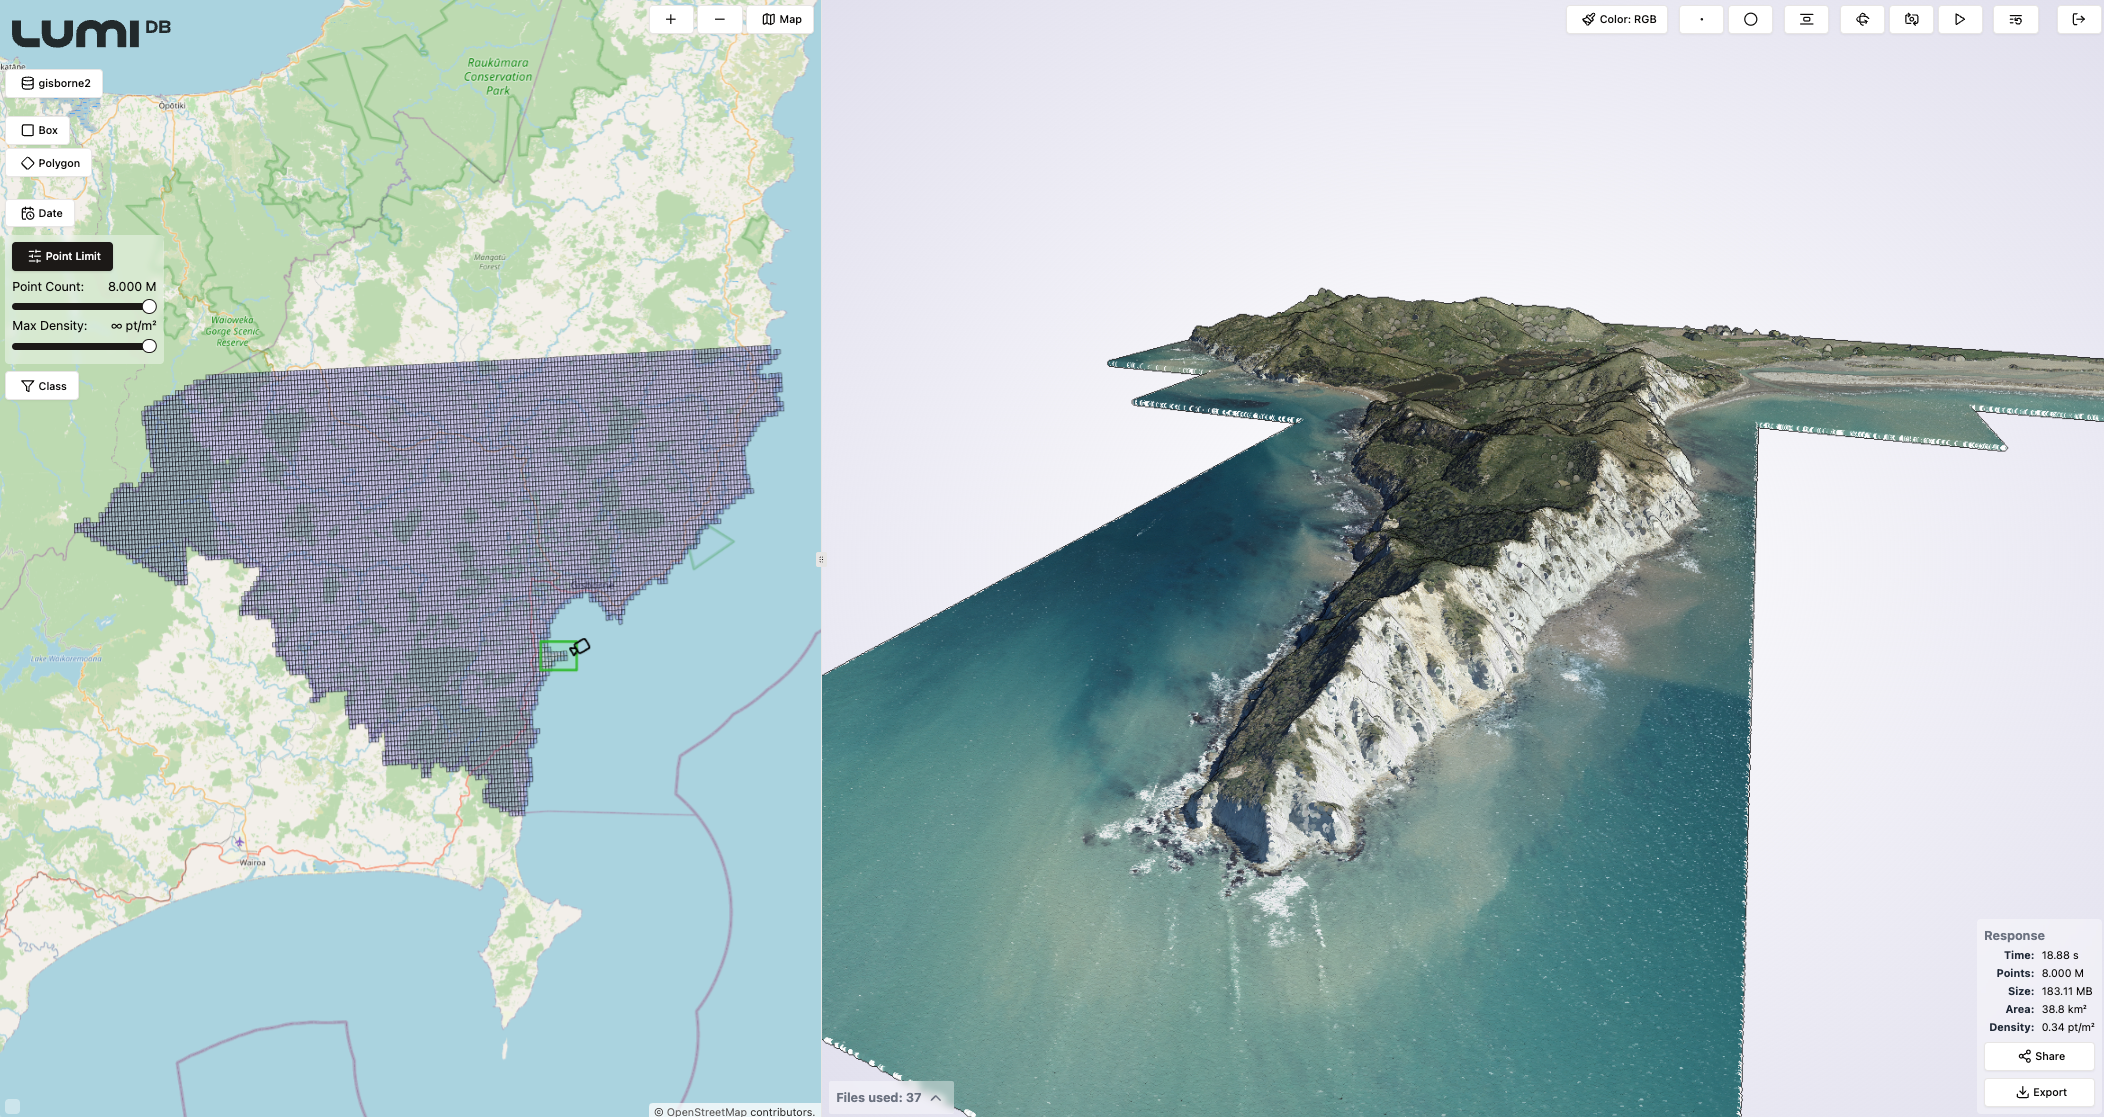
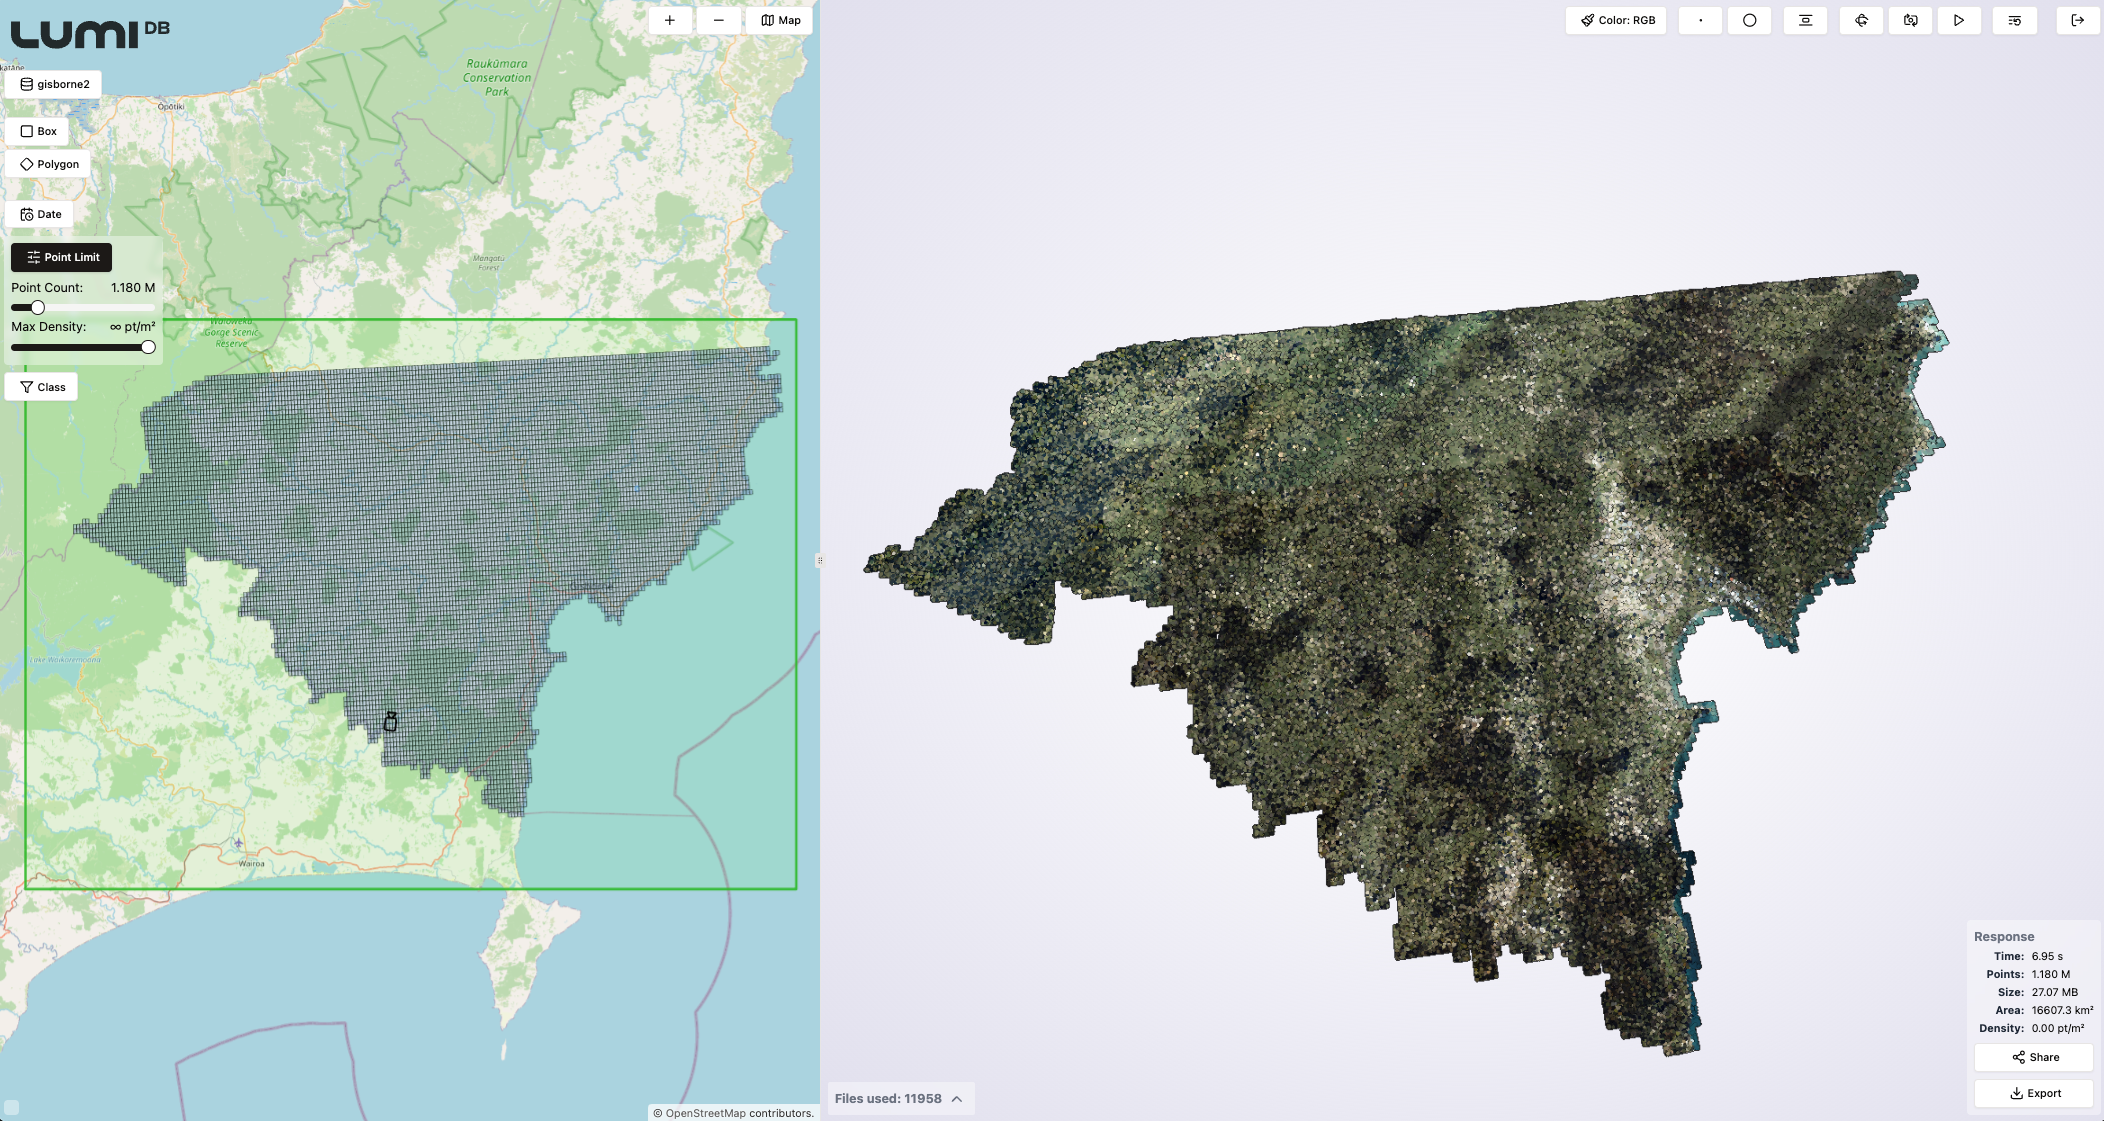
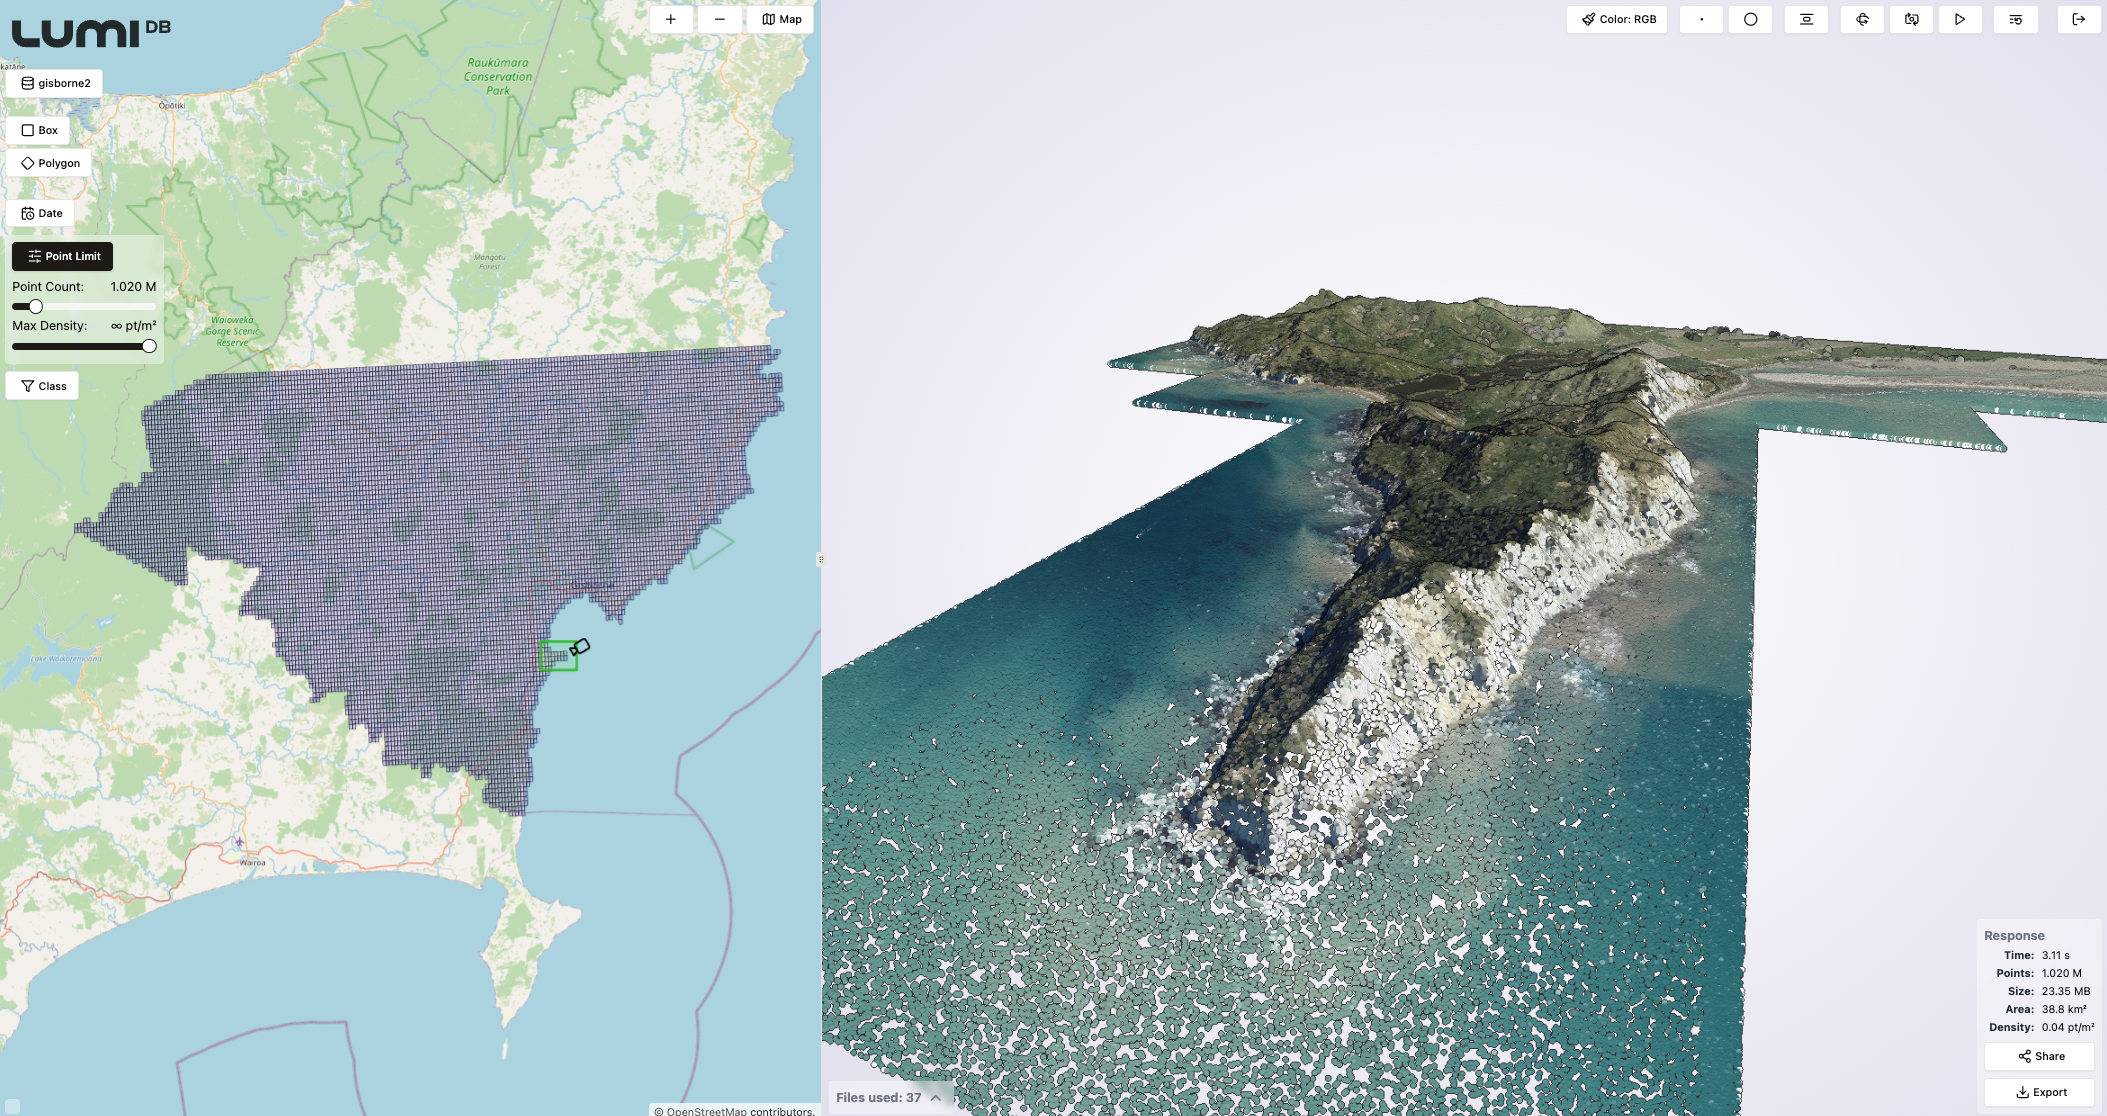
At visualization time, users can define parameters such as a point budget, which specifies the maximum number of points to return, ensuring smooth performance even with large datasets. The point budget is distributed evenly across the spatial region the user is querying, providing the best possible dataset for rendering. Alternatively, the user can also define a fixed density in e.g. points per square meters for the query output. In case more detail is needed in some parts of the visualization, users can simply issue multiple queries with different detail settings.
Below are a few screenshots from the LumiDB visual client that can be used to construct API queries visually, demonstrating how the LumiDB generated LODs of a large dataset looks in practice. The dataset used is the Gisborne LiDAR Point Cloud (2023) representing an area in New Zealand, and consisting of a total of 25,190 files and 262 billion points. The point density of the dataset is 30.11 points per m2.

By managing data in LumiDB, users gain advanced querying capabilities that not only optimize visualization but also support workflows requiring fine-grained analysis or integration into downstream applications via its API.
Interested in testing LumiDB? Request access to our closed alpha program and join the ranks of companies testing LumiDB today.
Written by
